The link between Bonds and Commodities in Stock Market Crashes

The link between Bonds and Commodities in Stock Market Crashes

Key Points:

  • Overall, and despite some exceptions, the last decades have been displaying an inverse correlation between bonds and commodities.
     
  • The 1970s: inflationary decade characterized by rising commodity market and falling bond prices. Find out more below!

  • The 1980s & 1990s: Disinflationary decades in which commodities prices fell and bond prices rose. The important role played by these two markets in triggering the stock market crisis in late 1987 is thoroughly analyzed.

  • The 2000s: Commodities and bonds continued to be inversely correlated but with two major exceptions: the stock market crashes during 2002 and 2007/2008.


As explained in this
article, bonds (USB) and commodities (CRB) usually trend in opposite directions. Rising commodity prices cause, generally, bond prices to fall whereas falling commodity prices result in higher bond prices. If you are curious to learn how the relationship between bonds and commodities evolved and how these two markets behaved during the stock market crashes in 1987, 2002 and 2007/2008, read on!

The 1970s: inflationary decade

During the 1970s, the baby boomers entered the labor market and they went on a spending spree, which evidently put a strain on prices and fueled inflation. Due to a couple of oil crisis, the price of this commodity rose dramatically triggering an almost out-of-control acceleration of the CPI, a key measure of inflation.

This changing environment was then characterized by explosive advances in the commodity market, rising bond yields (and falling bond prices). During periods of rising inflation and soaring interest rates, the value of bonds decline. During this decade, the CRB Index gained about 250% whereas Treasury bond yields appreciated by approximately 150%.

The 1980s and 1990s: Disinflationary decades

After the 1970s, a decade characterized by rising commodity prices and a weak bond market, the inflationary spiral came to an end, signaling the beginning of a disinflationary period. Disinflation refers to a situation when consumer prices are rising at a slower pace – the inflation rate dropped from about 13% at the start of the 1980s to 2% in 1986. The peak in the CRB index (in 1980) was followed, one year later, by a major bottom in bonds. In the early 1980s, the high real interest rates put a dent on inflation and commodities markets depreciated in value. The disinflationary period can be then described by falling commodities prices and interest rates. One major interruption of this trend occurred during the 1982-1984 period when the CRB Index bounced back significantly which led to rising interest rates. However and overall, commodity prices fell and bond prices rose throughout the last two decades of the 20th century. When inflation is under control and interest rates are declining, bonds rise as the appeal of safety and income lure investors to purchase them.

During the period 1984-1986, when the price of crude oil and the CRB index plummeted and the 30-year U.S. Treasury Bonds Index rallied significantly. Then, by mid-1986, when commodities were bottoming out, bonds were topping out. After that, commodities prices reversed into an uptrend, the Federal Reserve (Fed) adopted a more restrictive monetary policy and the bond market fell sharply. This decline led eventually to the stock market crisis in late 1987. The Fed became worried with the aftermath of the crash, it eased monetary policy and the bond market rebounded sharply. The CRB index continued to rise and the threat of inflation appeared again, aggravated by a U.S. Midwestern drought, which provoked the rise of some food components (such as grains and soybeans). However, with falling crude prices, any rise in inflation was deemed to be temporary (as well as the drought). Nevertheless, the Fed tightened its monetary policy and interest rates rose again. By 1989, the economic environment signaled a slowdown – characterized by the crisis in the saving and loans industry and an uncertain outlook for real estate – accompanied by falling commodities prices. The Fed decided to cut rates leading to a strong upward movement in bonds.

The chart below shows that turns in one market was frequently accompanied by turns in the other, and in the opposite direction.

In 1993, an upturn in commodities prices drove down bond prices. During 1997 and 1998 and as a result of the Asian currency crisis, plunging commodity prices pushed bond prices sharply higher. In 1999, with the recovery of Asian economies, bond prices fell sharply as the rising price of oil and industrial commodities pushed interest rates higher (as well as the CRB Index) as inflation fears resurfaced. The direction of commodity prices, as explained here, played again key role in the direction of interest rates.

Inverse correlation between bond and commodity prices between 1990 and 2001.

The 2000s: why some exceptions occurred to the inverse relationship?

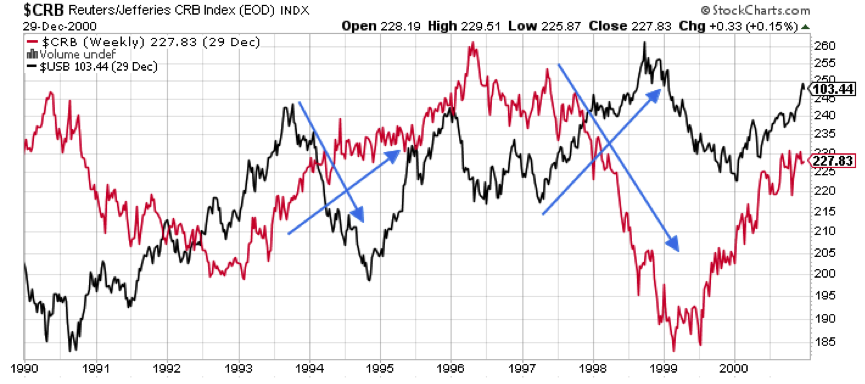
During the first two decades of this century, commodities and bonds continued to be inversely correlated but with two major exceptions: 2002/2003 and 2007/2008. In 2002, both markets trended upward even though roughly a year later, bond prices started to fall while the CRB index continued to appreciate (resuming their inverse relationship). What happened during 2002/2003? In the midst of fears of deflation (deflationary CPI and PPI figures), the stock market crashed. The Fed, worried with the aftermath of the crash, eased monetary policy, pushing interest rates lower (and bond prices higher), to stem the drop in the stock market. Hence, the dollar (by that time, a low-yielding currency) fell sharply which caused commodity prices to turn up before stocks, which was unusual. Some observers pointed out that the U.S. Government abandoned its strong dollar policy in order to boost prices. In addition, another reason explained why bond prices also rose during the second half of 2002 and it is related to which commodities did the rallying and the interpretation made by bondholders. In the third quarter of the same year, and as a result of a drought in the U.S. Midwest, corn and other grain prices soared which gave a big boost to the CRB index. Grain markets react to weather. However, copper prices, which are more closely correlated to the state of the economy and is deemed to be a better economic indicator than grain markets, fell dramatically over the same period. It appeared that bond traders were more concerned with the weak economic message sent by a falling copper than by the temporary rally occurred in the grain markets. And as copper was negatively correlated to bond prices, bondholders decided to keep their positions despite rising CRB index.

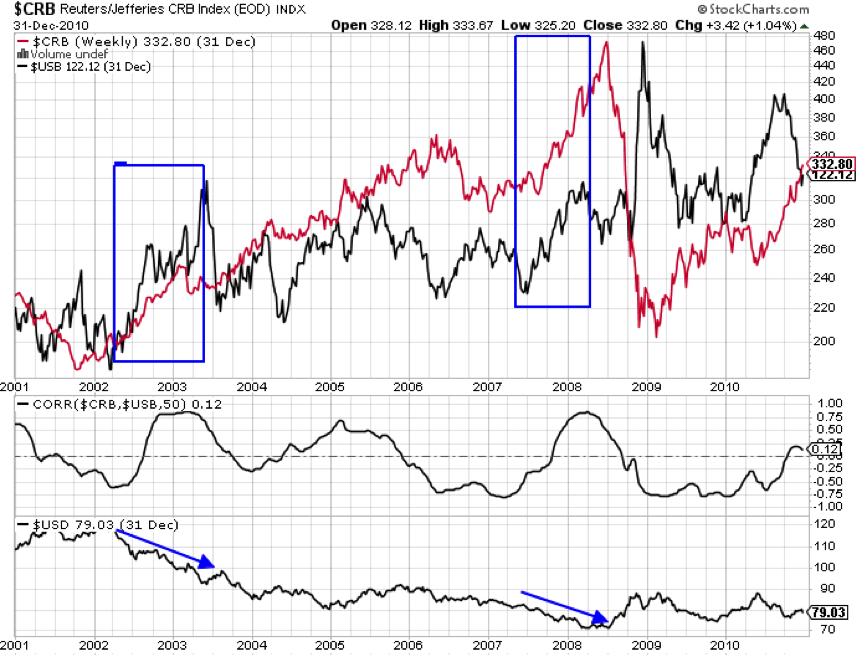
In 2006, falling commodity prices helped bond prices to bounce back. One year later, another exception took place, more precisely during the second half of 2007 and the first semester of 2008, periods when both markets trended higher. This was caused by negative trends in the stock and dollar markets. The former started to fall dramatically during the second half of 2007, which caused a massive flow out of stocks and into Treasury bonds. Additionally, the Fed, worried with the aftermath of the crash, eased monetary policy, pushed interest rates lower (and bond prices higher), to attenuate the drop in the stock market (resulting from the bursting of the housing bubble). Hence, the dollar continued to fell sharply which pushed commodity prices higher. This change to the normal bond/commodity relationship was kept until the start of the second semester of 2008, when commodity prices started to weaken due a US Dollar bottom (and bond prices to strengthen).

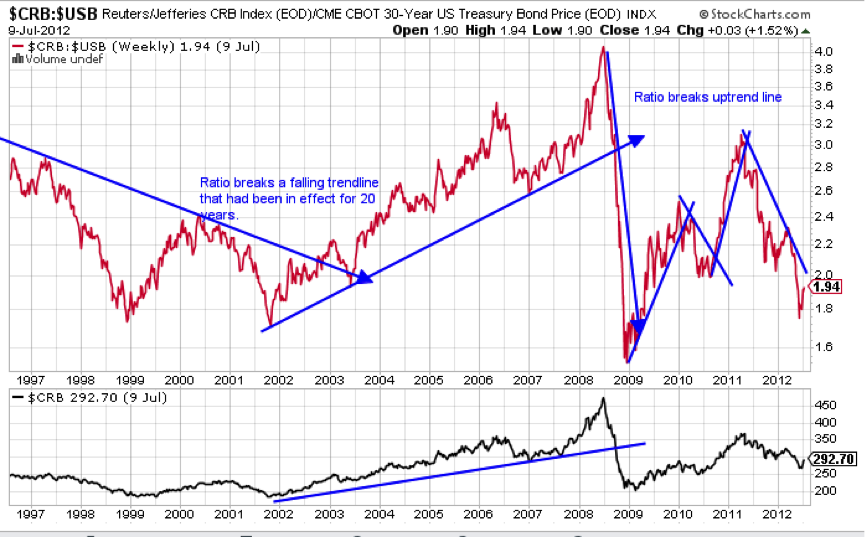
The CRB Index/30-year Treasury Bond Ratio: historical behaviour

Ratio charts are useful indicators to determine which asset class is stronger at any point in time and to spot trends changes. Traditional technical analysis indicators such as moving averages, support, resistance levels and so forth can also be applied to these charts. The commodity/bond ratio peaked in 1981 and fell for about 20 years meaning that bonds were a better place to be compared to commodities. However, and from 1986 to mid-1988, commodities outperformed bonds by about 30%. During part of the same period (mid-1987 until mid-1988), commodities also outperformed stocks by 25%. This period was characterized by a stock market crash and an upward movement in commodities due to the Midwest drought.  

The following chart plots the ratio from 1996 until 2012. In 2004, a downward trend line that was in place since 1984 was broken and a rising ratio began (favoring commodities over bonds) until 2008, year in which Treasuries soared and commodities plunged (during the height of the financial crisis). I have drawn some trend lines in the chart in order to make it easier to identify turns. A rising ratio indicates that the commodity market is the place to be whereas a falling ratio indicates the opposite.

Conclusion

I reckon most people would agree with these quotes: “hard times teach us the most valuable lessons” or “The past is where you learned the lesson, the future is where you apply the lesson”! The relationship between these two markets during the most stock market crashes is a valuable lesson for the present and future. For further information on the current situation along with trading ideas, read this article.

Disclosure: Please remember to consider every piece of investment information you receive here as an idea for further consideration. It does not constitute a recommendation to buy or sell assets and does not take account of your adjectives, or your financial situation. At the time of writing this article, I do not have any position in the assets mentioned. Thank you for reading.

This Post Has 2 Comments

  1. Mendy Tuma

    Hey there! I just want to offer you a huge thumbs up for your excellent info you have
    here on this post. I am coming back to your blog for more soon.

Leave a Reply