Investors often wonder if there were any warning signs that could have helped them protect their portfolios from the 2000 Dot-Com Bubble burst. Did the bond market provide such a signal? Read on to discover whether bonds gave an early warning before the market meltdown.
Are you aware that commodity prices affect bond prices, which in turn influence stocks? That said, could we have predicted the stock market crash as bonds usually change direction before stocks?
Meaning that if you want to be a successful investor, you will need to consider both the bond and commodity markets. We will help you on this journey of discovery!
The Link between Commodities and Bonds
In a nutshell, rising commodity prices are viewed as a leading indicator of inflation and can dictate a central bank’s monetary policy and the direction of interest rates. Higher inflation may translate into higher interest rates which negatively affects bond prices. As a result, Commodity and Bond prices usually trend in opposite directions.
For example, soaring commodity prices normally cause bond prices to fall whereas falling commodity prices result in higher bond prices. Furthermore, bond prices move inversely to bond yields.
However, in the havoc of a stock market, when stock prices are falling… the market is overwhelmed by a panic! And nobody seems to know what to do, the correlation between commodities and bonds can run WILD!
In short, besides discovering if the bond market led stocks before the Dot-Com Bubble crash, we will also explore the relationship between commodities and bonds before and during the crash!
The 1990s: Disinflationary decade
Overall, commodity prices fell, and bond prices rose during the last two decades of the 20th century. The commodities reached lower levels in the 1990s as the disinflationary environment prevailed. Moreover, falling commodity prices and interest rates are an excellent way to explain a disinflationary period.
And here’s the thing: bonds usually rise when inflation is in check, and interest rates are declining. This generally appeals to investors because they are attracted to the bonds promise of safety and income.
Now, Let’s look at the 1990´s trend through this chart…
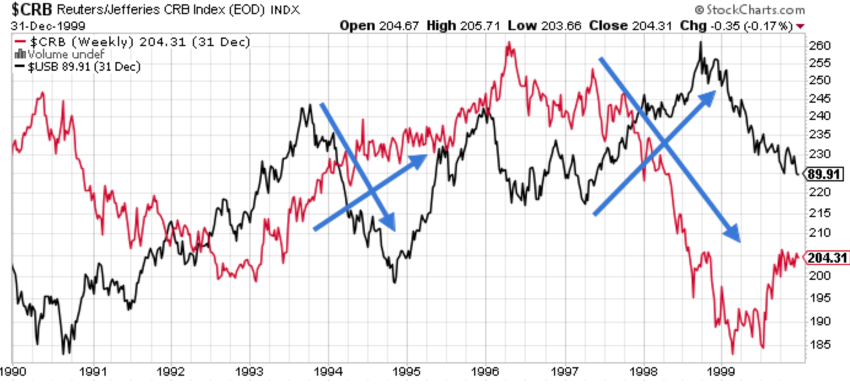
As you can see, an interruption of the downward trend of the commodity market took place, for example, in 1993 when prices began rising again (red line). The rise in the commodity market led to a downturn in bond prices with some time lag (black line). It is an excellent example of how intermarket relationships can sometimes seem “out of line” for some time but still carry a warning.
But as we move further and look at the trends during 1997 and 1998, notice how both markets did exactly what they would be expected to do during a threat of falling prices (which is deflation). Commodity prices fell sharply while bond prices surged. This was the time of the Asian currency crisis.
In 1999 when the Asian economies were recovering, bond prices fell sharply. The rising price of oil and industrial commodities pushed interest rates higher as inflation fears reemerged.
But what happened before the Dot-Com Bubble crash that lasted between September 2000 and February 2003?
Could you have predicted the crash as bonds usually change direction before stocks?

In mid-1999, and considerably before the stock market crash, commodities started appreciating in value significantly.
Now, Let’s look at the trend through this chart…
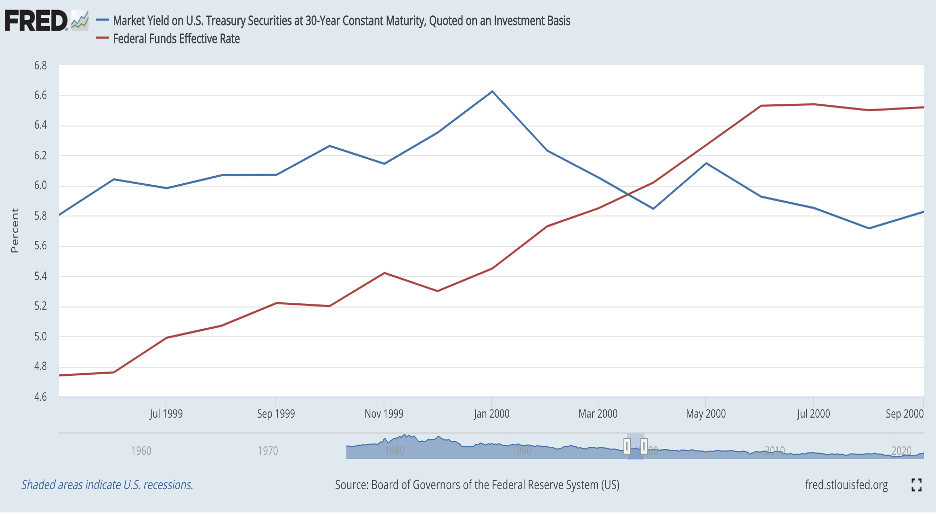
As you can see, this brought about a rise in short-term interest rates as the Federal Reserve adopted a more restrictive monetary policy (red line). The Fed started increasing the fed funds rate by June 1999 and followed the same path until the end of 2000. As a result, the 30-year Treasury bond yield kept rising (blue line) which could have been regarded as a key cautionary signal that might have led to the beginning of a stock market crisis. However, the increase in the fed funds rate had a momentary and limited impact on long-term interest rates. The 30-year treasury bond representative peaked in January 2000, eight months before stocks peaked that September.
So, the 30-year Treasury bond yield unexpectedly started falling in January 2000 (and the bond market rising). This went against the intermarket relationship which stated that at major tops, we expect bonds to decline before stocks.
Nevertheless, the fed funds rate was rising since June 1999, which could have been viewed as a key cautionary signal that led to the stock market crisis in September 2000.
And what happened during the Dot-Com Bubble crash?

The 2000 dot-com market crash caused a massive flow out of stocks and into Treasury bonds, pushing bond prices higher (upper black line).
With this downturn of stock prices and the hovering deflation over the heads, the Fed eased its monetary policy, trying this way to control the aftermath of the crisis. The loose monetary policy, initiated by the Fed in the beginning of 2001, pushed down interest rates, which also led to increased bond prices (black up arrow).
Furthermore, the dollar, which became a low-yielding currency, fell sharply at the start of 2002 (green down arrow). This caused commodity prices (red up arrow) to turn up before stocks. This was unusual since stocks have a history of turning up first at bottoms.
So, starting in 2002 and until the end of the bear market, bond and commodity prices were both on the rise. In the chaos of this Dot-Com Bubble crash, the inverse correlation between commodities and bonds was temporarily lost!
But, along with the loose monetary policy, what caused this new pattern?
In the third quarter of 2002, and as a result of a drought in the U.S. Midwest, some commodities prices soared, boosting the Commodity Index. However, copper prices, which is viewed as a better economic indicator than grain markets, fell over the same period. And as copper is negatively correlated to bond prices, bondholders decided to hold their positions and not sell their bonds, despite the rising Commodity Index. So, the interpretation made by bondholders of the situation contributed to explain why bond prices also rose during that period.
Major Takeaways:
- The threat of a deflationary environment dampened the normal bond-stock relationship. That said, unlike of what happened in the 1970s and 1980s, falling bond yields (or rising bond prices) preceded the 2000 stock market crash. So, falling bond yields became bad for stocks.
- Commodities and bonds continued to behave as two opposite sides of the fence with this significant exception: 2002/2003. Meaning that, in the chaos of this stock market crash, the inverse correlation between commodities and bonds can run amok!
- Changes to the normal bond/commodity relationship are usually caused by action in stocks or the dollar.
- The dollar and commodities trend in opposite directions.
Thank you for reading! If you would like to keep up on the latest updates, come by and connect with us on TWITTER. And do not forget to subscribe to our YOUTUBE channel for more interesting content…