<strong>The 2008 financial crisis: Did Bonds sense the crash?</strong>

The 2008 financial crisis: Did Bonds sense the crash?

In this piece of writing, we will find out if the bond market could have helped you to anticipate the 2008 financial crisis. Could we have predicted the Great Recession as bonds usually change direction before stocks?

Investors often seek safe havens during stock market crashes, but what is the best strategy for doing so? Are you aware that commodity prices affect bond prices, which in turn influence stocks? Meaning that if you want to become a successful investor, you will need to consider both the bond and commodity markets. 

The Relationship between Commodities and Bonds

In a nutshell, rising commodity prices are viewed as a leading indicator of inflation and can dictate a central bank’s monetary policy and the direction of interest rates. Higher inflation may translate into higher interest rates which negatively affects bond prices. As a result, Commodity and Bond prices usually trend in opposite directions.

For example, soaring commodity prices normally cause bond prices to fall whereas falling commodity prices result in higher bond prices. Furthermore, bond prices move inversely to bond yields.  

However, in the havoc of a stock market, when stock prices are falling… the market is overwhelmed by a panic! And nobody seems to know what to do, the correlation between commodities and bonds can run AMOK! 

In short, besides discovering if the bond market led stocks before the Great Recession, we will also explore the relationship between commodities and bonds before and during the crash!

That said, what happened before the Great Recession, a period of market decline that lasted between October 2007 and March 2009?

Was it so sudden and unexpected as many people think?  Again, could we have predicted the crash as bonds usually change direction before stocks?

This chart shows the ECB Deposit Facility Rate for Euro Area and the Federal Funds Effective Rate between 2001 and 2004.

Now, let’s fast backward. 

The loose monetary policy, initiated by the Federal Reserve in the beginning of 2001 and lasting until mid-2004, pushed down interest rates so much that the dollar became a low-yielding currency compared with the euro and other higher-yielding currencies by the end of 2001 (red line below the blue one).

This chart shows the correlation between commodity markets and the U.S. dollar between 2002 until the beginning of the 2008 stock market crisis.

As you can see, the major peak in the U.S. dollar (green circle) at the start of 2002 led to a major uptrend in commodity markets (red up arrow) that lasted, at least, until the beginning of the stock market crisis. That action was consistent with the intermarket principle that a falling dollar (green down arrow) usually results in higher commodity prices (red up arrow). Actually, a falling dollar is one of the tactics that the Fed used to combat the deflationary threat.

Furthermore, the Fed, preoccupied with deflation, became reluctant to raise interest rates which was bullish for commodity prices. Since 2002 and until mid-2004, commodity inflation coexisted with interest rate deflation, which is unusual.

From that time onwards, more specifically from mid-2004 until mid-2006, the Fed, with inflationary pressures intensifying, increased the fed funds rate (red line). Contrary to expectations, during this period, the bond market hardly moved (blue line and using the 30-year treasury bond yield as a reference).  That said, the increase in the fed funds rate had a very limited impact on long-term interest rates.

By mid-2007, four months before stocks peaked in October, the 30-year treasury bond yield (blue line) and the fed funds rate (red line) peaked around the same time (blue circle).

And by mid-2007, four months before stocks peaked in October, the 30-year treasury bond yield (blue line) and the fed funds rate (red line) peaked around the same time (blue circle).

Therefore, the 30-year treasury bond yield started falling by June 2007 (and the bond market started rising). This again went against the traditional intermarket relationship which stated that at major tops, we would expect bonds to decline before stocks.

That said, a downturn in bond yields acted as a leading indicator for the later downturn in stocks.

And what happened during the market crash that started in October 2007?

This chart shows how bonds and commodities behaved during the chaos of the stock market crash.

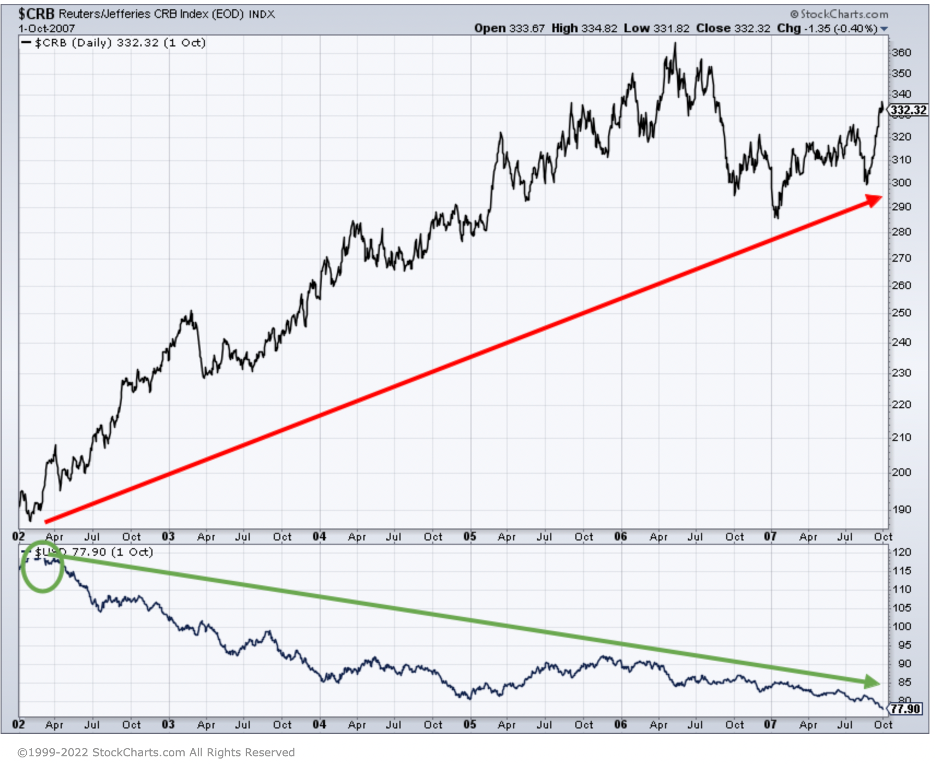
During the second half of 2007 and the first semester of 2008, both bonds and commodities rallied together (black and red up arrows).  In the chaos of this stock market crash, the inverse correlation between commodities and bonds was temporarily lost!

As was the case during part of the dot-com market crash, this exception was caused by the decreasing stock and dollar prices. The stock market started to fall dramatically from October 2007 onwards. This caused a massive flow out of stocks and into treasury bonds (upper black line).

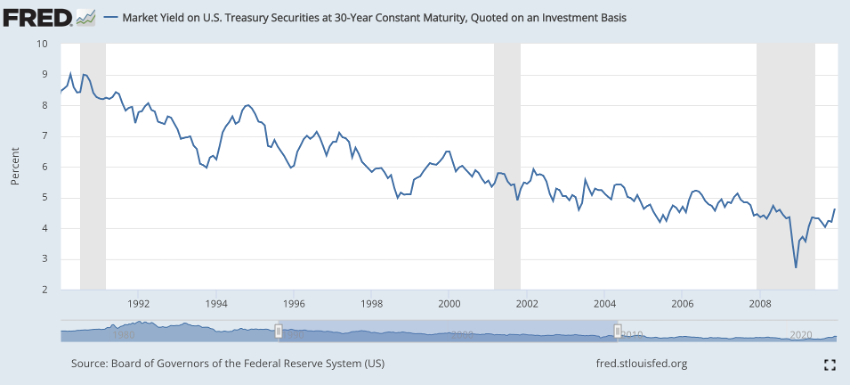
By this time, the Fed, worried about the slumping housing sector, tightening credit market and stock market volatility, eased the monetary policy and pushed interest rates lower. And you all can guess what this led to: higher bond prices. And as the U.S. dollar was plunging continuously (green down arrow), the commodity rally kept going (red up arrow).

As a result, bond and commodity prices rose together roughly until the beginning of the second semester of 2008 when the commodity prices started to weaken mostly due to a US Dollar bottom. Furthermore, with short-term interest rates near zero, poor economic growth and a real threat of deflation, the Fed began, in November 2008, the first round of an unconventional approach to monetary policy known as quantitative easing. Bonds kept rising as an appeal of safety and income. And the commodity correction also helped push bond prices sharply higher.

So, for the last six months of 2008 and until the stock market bottom in March 2009, commodities and bond prices reverted to their normal inverse correlation.

Major Takeaways:

– The threat of a deflationary environment dampened the normal bond-stock relationship. That said, unlike of what happened in the 1970s and 1980s, falling bond yields (or rising bond prices) preceded the 2008 stock market crash. So, falling bond yields became bad for stocks.

– As you can see in the chart, plunging interest rates and bond yields during the 1990s and 2000s are usually symptomatic of both disinflationary and deflationary environment.

As you can see in the chart, plunging interest rates and bond yields during the 1990s and 2000s are usually symptomatic of both disinflationary and deflationary environment.

– The prevailing historic correlation between commodities and bonds continued negative throughout the 1990s and the 2000s. The traders were laughing all the way to the bank with two significant exceptions: 2002/2003 and 2007/2008. Meaning that, in the chaos of this stock market crash, the inverse correlation between commodities and bonds can run amok!

– Changes to the normal bond/commodity relationship are usually caused by action in stocks or the dollar.

– The dollar and commodities trend in opposite directions.

Thank you for reading!

Oh, by the way! Interested in knowing what occurred during the 1970s and 1980s? Click here. Or curious to know what happened before and during the Dot-Com Bubble? Click here.

If you would like to keep up on the latest updates, come by and connect with us on TWITTER. And do not forget to subscribe to our YOUTUBE channel for more interesting content…

Disclosure: Please remember to consider every piece of investment information you receive here as an idea for further consideration. It does not constitute a recommendation to buy or sell assets. And it does not take account of your adjectives, or your financial situation. At the time of writing this article, I do not have any position in the assets mentioned.

Leave a Reply