Investors often seek safe havens during stock market crashes, but what is the best strategy for doing so? Do you know that the direction of stock prices is influenced by the direction of bond prices? And are you also aware that commodity prices affect the direction of bond prices?
We’ve all heard the quote “Risk comes from not knowing what you’re doing.” In our interconnected world, trying to trade the markets without understanding how they relate to one another is like trying to drive a car at full speed for the entire journey. The engine will be at stress, will heat up more than advisable, the car may become unstable and may cause you to lose control. For example, if you focus your attention only on the stock market without considering what is happening in the remaining markets, you will miss vital directional clues that could help you to protect your portfolio from stock market crashes.
Bonds and Commodities typically trend in the opposite directions. Rising Commodity prices cause, typically, bond prices to fall. And falling commodity prices result in higher bond prices. Furthermore, bond prices and bond yields are inversely related.
However, in the havoc of a stock market, when stock prices are falling, the market is overwhelmed by a panic! And nobody seems to know what to do! The correlation between commodities and bonds can run AMOK!
In this article, we will explore the relationship between commodities and bonds during the 1970s and 1980s as well as how these markets behaved before and during the two biggest stock market crashes that occurred in that period! And how the bond market led stocks before both crashes!
So, if you are curious to know, keep reading….
The 1970s: inflationary decade
The 1970s was the decade baby boomers entered the labor market. Think of 76 million people growing up, settling in their own houses and getting jobs. We can only expect them to go on a spending spree!
So, when they started earning and spending their money, the prices of everything skyrocketed. We faced what we now know as one of the highest inflation rates in history!
Furthermore, the Yom-Kippur war of 1973 and the Iranian Revolution of 1979 resulted in disruptions of oil supplies. These events led to an increase in the value of this commodity. This, in turn, caused the Consumer Price Index, an important measure of inflation, to accelerate almost uncontrollably.
So, these and other changes in the market environment led to an explosion in commodity prices and bond yields. The U.S. Commodity Research Bureau Index gained about 250% whereas Treasury bond yields increased by around 150%. Meaning that bond prices fell dramatically!
This all made sense because rising commodity prices tend to lead inflation which suggest that it is only a matter of time before a central bank tightens its monetary policy, which will lead to rising interest rates. And bonds decline when interest rate rises.
Overall, this was a decade characterized by rising commodity market and falling bond prices, trending in opposite directions as expected!
But what happened before the stock market crash that lasted between February 1973 and December 1974?
Could you have predicted the crash as bonds usually change direction before stocks?
In 1972, and considerably before the stock market crash, commodities started appreciating in value significantly.
Now, Let’s look at the trend through this chart…

As you can see, the explosion in commodity markets contributed to an upturn in the 10-year Treasury bond yields. From that moment onwards, bond prices kept falling (and yields increasing – up arrow). This was a key cautionary signal that led to the stock market crisis in early 1973. So, we can confirm that the bond market was a reliable leader indicator for stocks as it changed direction before stocks with, at least, a one-year lag!
And what happened during the stock market crash?
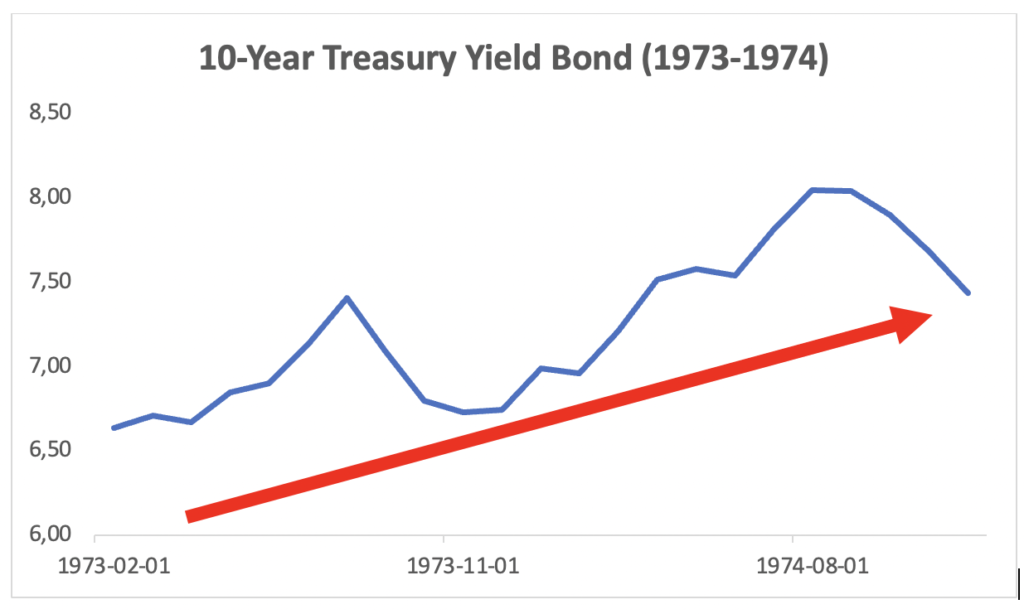
Despite the Federal Reserve (Fed) kept raising rates until November 1974, commodities continued to rise, and the bond market continued to fall (and yields to rise – up arrow).
This was a decade when commodities and bonds were following their inverse relationship no matter what! When commodity prices are advancing, it is only a matter of time before interest rates start to move up and hurt the bond market. And bonds lead stocks by a varying period of time on the way down.
The 1980s and 1990s: Disinflationary decades
As you saw, over the course of the 1970s, commodities prices were on the rise, and the bond market was suffering. However, soon after the 1970s, this crazy decade of inflation came to an end, meaning that consumer prices began rising at a slower pace.
Overall, commodity prices fell, and bond prices rose during the last two decades of the 20th century. The commodities reached lower levels in the 1990s as the disinflationary environment prevailed. Again, falling commodity prices and interest rates are an excellent way to explain a disinflationary period.
During the 1980s, the value of bonds and commodities were fluctuating, but they were almost always opposite to each other.
But what happened before the “Black Monday” stock market crash of October 19, 1987?
Was it so sudden and unexpected as many people think? Could we have also predicted the crash as bonds usually change direction before stocks?
Throughout this decade, a couple of interruptions of the downward trend of the commodity market as well as the upward trend of the bond market occurred during the 1982-1984 period and by mid-1986 when commodities bounced back significantly (up arrow).

This brought about a rise in interest rates as the Fed adopted a more restrictive monetary policy to fight inflation and the downward pressure on the dollar.
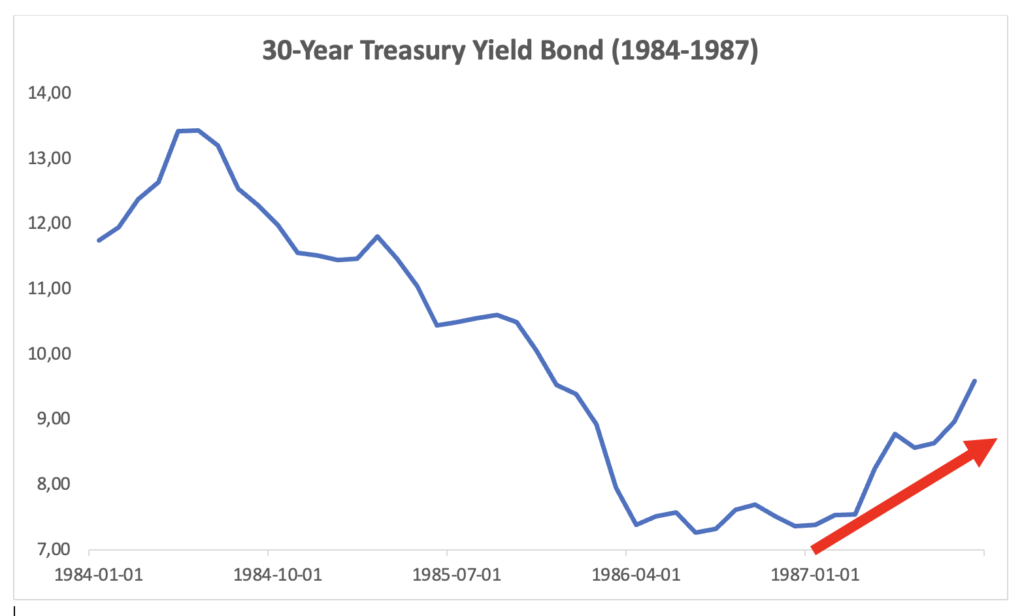
As a result, the bond market fell sharply in the beginning of 1987 (and the 30-year Treasury bond yield increasing – up arrow). This was a key cautionary signal that led to the stock market crisis in October. So, we can also confirm that the bond market was a reliable leader indicator for stocks as it changed direction before stocks with, at least, a few months lag!
And what happened during the 1987 stock market crash which lasted until the end of the same year?
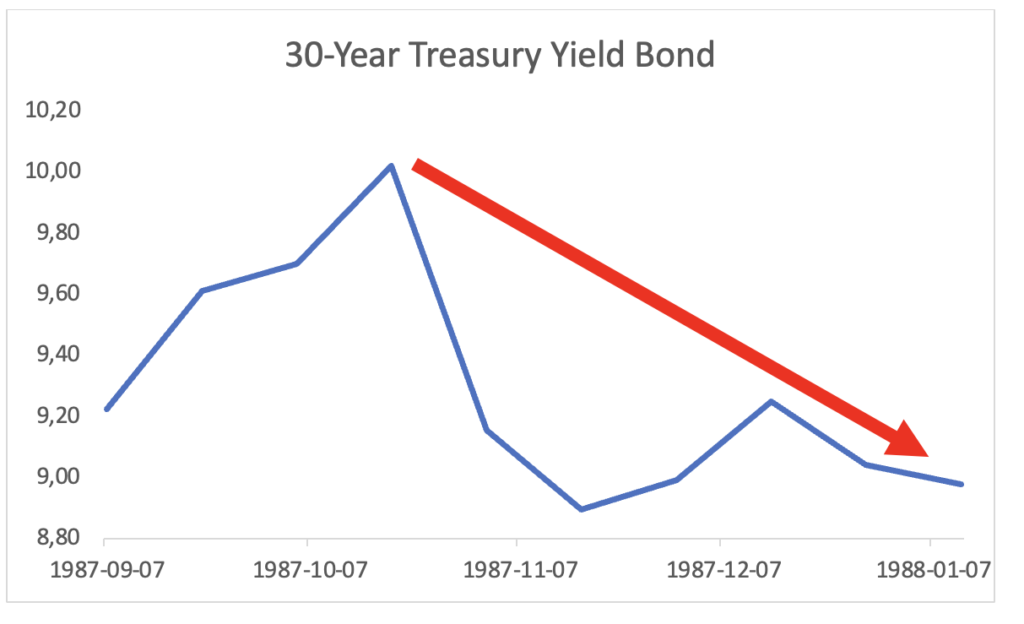
The Fed, worried with the aftermath of the crash, decided to cut rates and the bond market rebounded sharply (and yields fell – down arrow). Commodities continued to rise.
Meaning that, in the chaos of this stock market crash, the inverse correlation between commodities and bonds was lost! They fluctuated in the same direction! Unlike of what happened during the 1973-1974 stock market crash!
But as Jim Cramer once said, “Every once in a while the market does something so stupid, it takes your breath away.”
However, in both stock market crashes, we can confirm that the bond market was a reliable leader indicator for stocks as it changed direction before stocks with, at least, a few months lag!
Thank you for reading and always remember the quote, “The past is where you learned the lesson, the future is where you apply the lesson”!
If you would like to keep up on the latest updates, come by and connect with us on TWITTER. And do not forget to subscribe to our YOUTUBE channel for more interesting content…