Key Points:
- Copper, known as a barometer of global economic health, is sensitive to economic trends and it is closely tied to the peaks and troughs of the global economy and stocks. In at least four recessions since 1970, the ups and downs of the stock and copper market coincided fairly closely.
- When the economy is slowing, demand for copper will be lower, raising fears of an impending recession. Furthermore, some analysts consider it as a leading indicator for stocks.
- Overall, and despite some exceptions, the first decades of this century have been displaying a positive correlation between copper and stocks. These exceptions are thoroughly analyzed below.
- This article will help you to better understand the dynamics of the copper-stock relationship. You will find out which factors should be taken into account when trying to predict the future price movements of copper.
Copper is a key industrial commodity and it is known as a barometer of global economic health because of the material wide usage in automotive, infrastructure, construction, power transmission and electronics as well as other industrial applications. Furthermore, some people consider it as a leading indicator for stocks. However, and during this decade, the red metal disconnected from the stock market for some periods of time, raising concerns about the statistical significance of the copper-stock correlations.
The following chart shows the trend of the price of copper and the S&P 500 over the course of this century.
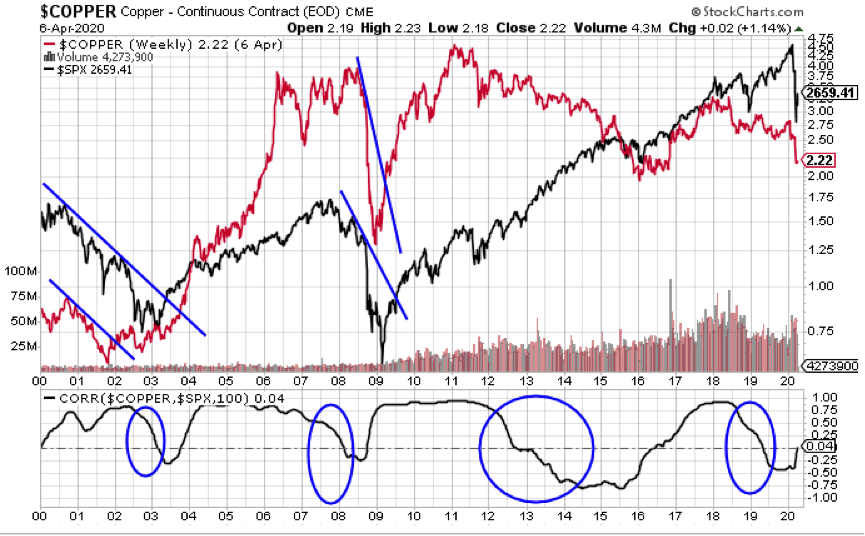
During the first two decades of this century, copper price has been positively correlated to the trend of the S&P 500 Index (SPX) with a few exceptions: 2002/2003, 2008, 2013-2015, and 2018/2019.
The first two exceptions
In 2002, copper prices started to trend upward while the stock market index continued to depreciate. Their relationship resumed roughly a year later with the upturn of the SPX. What happened during 2002/2003? In the midst of fears of deflation (deflationary CPI and PPI figures), the stock market crashed. The Fed, worried with the aftermath of the crash, eased monetary policy, pushing interest rates lower (and bond prices higher), to stem the drop in the stock market. Hence, the dollar (by that time, a low-yielding currency) fell sharply which caused commodity (including copper) prices to turn up before stocks, which was unusual.
Another exception took place during the first semester of 2008, period when the stock market started to fall sharply whereas copper prices remained stable. This change to the normal copper/stock market relationship was kept until the start of the second semester, when copper prices began to weaken as well.
During the spring of 2011, falling copper and other commodities prices as well as a crisis in Europe, which caused the Euro to fall and the dollar to rise, warned that stock markets could suffer a downward correction. The appreciation of the dollar during that year caused foreign stock markets, like Brazil and China (which are tied to commodities) to fall further than U.S. stocks. In 2012, the situation in Europe became more stable and the euro appreciated whereas the dollar weakened. Stock markets had a good year as falling dollar favored foreign stock markets. Copper and other commodities trended also upward. As part of Fed’s effort to alleviate the financial effects of the sub-prime crisis, the launch of the third round of quantitative easing in September 2012 helped to reinforce the upward trends of stocks and commodities whereas the dollar and Treasuries bonds were put under strain. Their strategy was to purchase Treasuries to suppress their yields and to inject liquidity into the economy.
LME stockpile levels: a better picture of the demand-and-supply balance
Over this period, the third exception occurred. The copper-stock relationship began to soften and became inversely correlated – both the stock market and the U.S. economy rose whereas copper fell. As with any other asset, copper is influenced by fundamental, technical and sentimental drivers. Some people blamed the London Metal Exchange (LME) stockpiles for the copper’s fall. The LME is the world’s largest market for industrial metals trading, where the majority of global non-ferrous futures business is conducted. Additionally, the LME manages a network of warehouses aimed at storing the excess supply of copper. Note that stockpiles levels are normally very marginal when compared with the global trading volume but, despite that, they give traders a fundamental read on copper’s current balance. High or rising stockpiles mean falling demand or/and overproduction whereas low or falling stockpiles mean rising demand or/and lower supply levels.
Over the period 2008-2012, the global consumption of copper had an average of 52k metric tons per day. Meanwhile, in January 2013, the LME stockpile level at 340k metric tons was equivalent to 6,5 days´ worth of copper. Did this indicate a tight economic balance? Some people have pointed out that tight is any figure below 5 days. So, according to this benchmark, it was not a tight supply-demand balance. When this disconnection between copper and the stock ended and copper began again to rise (by end of 2015), the LME stockpile level was considerably lower, at 235k metric tons. This figure, considered to be a low stockpile level along with other fundamental factors, might have helped copper to resume its upward path. Bad news? In 2014, and despite rising stock market and low LME stockpile levels (in some months below the 5-day inventory threshold), a falling copper disconnected from both the SPX and the LME stockpiles.
Copper and Commodities: Close correlation and its effects
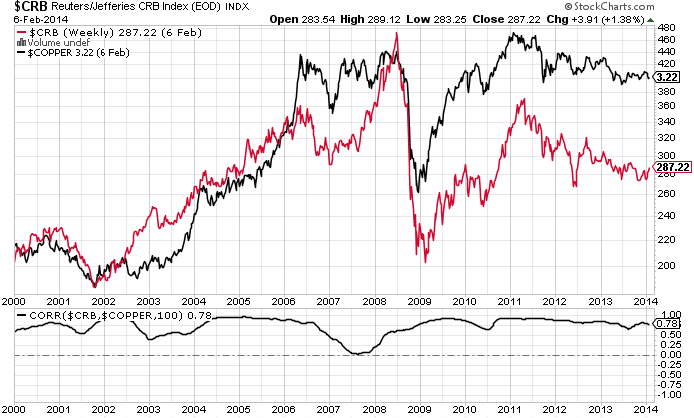
Other explanatory variable may certainly explain why the behavior of copper did not make sense. Which? Historically, that is impressive how copper and commodities have been extremely correlated (chart below). And commodity (CRB) prices have been falling during the second decade of this century.
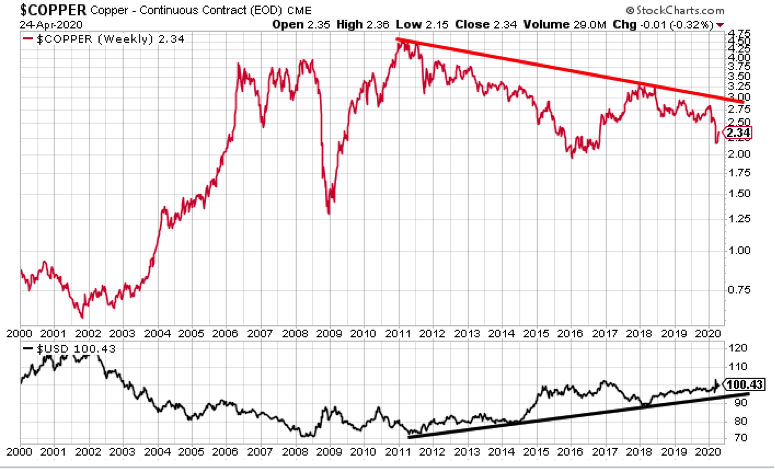
Given the strong inverse correlation between the dollar (USD) and commodities, a change in the trend of the dollar index leads or coincides with a change in direction of commodities and vice-versa. Therefore, the dollar hit the bottom and started rising during 2011, continuing to rally throughout this decade which causes a negative impact on commodity prices and indirectly on copper prices (as shown in the chart below).
Alongside falling commodities, the International Copper Study Group (ICSG) forecasted of a supply surplus in 2014, which also meant bad news for the falling copper prices.
During both the second semester of 2018 and the whole year of 2019, the copper-stock correlations turned negative again – both the stock market and the U.S. economy rose (despite the fact that the former suffered a strong correction in late 2018) whereas copper fell slightly. This time the London Metal Exchange (LME) stockpiles could not be blamed, as levels were actually low. In 2018, the global consumption of copper had an average of 67k metric tons per day. Over the course of the second semester of 2018 and the whole year of 2019, the LME stockpile levels were below 335k metric tons which was equivalent to 5-day inventory threshold. Despite these low figures, copper prices unexpectedly fell. Therefore, despite rising stock market and low LME stockpile levels, a falling copper disconnected again from both the SPX and the LME stockpiles. Any explanation? Again, the dollar continued to rise, which had a negative impact on commodity prices and indirectly on copper prices (as shown in the chart below).
Out of curiosity, how did LME stockpiles behaved in the Great Recession?
During 2007, the average LME stockpiles figures were very low, between 2 to 4 days’ worth of supply. In late 2007, the stock market started to fall dramatically as result of the subprime mortgage crisis. As the economy deteriorated, the miners began facing some troubles in finding consumers, which led to an increasing number of deliveries to the LME warehouses (resulting in soaring LME stockpile levels along with plunging copper prices). During the panic, copper and the stock market were highly correlated – with a time lag of some months as stock market started falling by late 2007 whereas copper prices only plunged in the second semester of 2008. Copper’s fundamentals importance seemed to have disappeared. Furthermore, both the SPX and Copper’s downward trend lines were broken at almost the same time, in the spring of 2009. Interestingly, in March 2009, LME stockpile levels reversed its upward movement, starting a downward path that lasted until August (even though figures did not fall under the 5-day inventory threshold), which supported rising copper prices. Out of curiosity, refined copper usage achieved new record highs over the period 2010-2012.
Conclusion
After studying the historic relationship between copper and stocks, I can conclude that other factors, besides the stock market (in this article), we explain the key role of the Chinese market), should be taken into consideration when attempting to predict future price movements of copper such as: LME stockpile levels and the CRB Index. For further information on the current situation along with trading ideas, read this article.
Disclosure: Please remember to consider every piece of investment information you receive here as an idea for further consideration. It does not constitute a recommendation to buy or sell assets and does not take account of your adjectives, or your financial situation. At the time of writing this article, I do not have any position in the assets mentioned. Thank you for reading.